4.8 Probabilities
Predict probabilities of insurance purchase using modelRF2.
pred_prob <- predict(modelRF2,
                     select(prospects4, -Id, -starts_with("Call")),
                     type = "prob")
Plot these probabilities
ggplot(pred_prob, aes(x = Yes)) +
  geom_histogram(color = "white") +
  theme_minimal()
## `stat_bin()` using `bins = 30`. Pick better value with `binwidth`.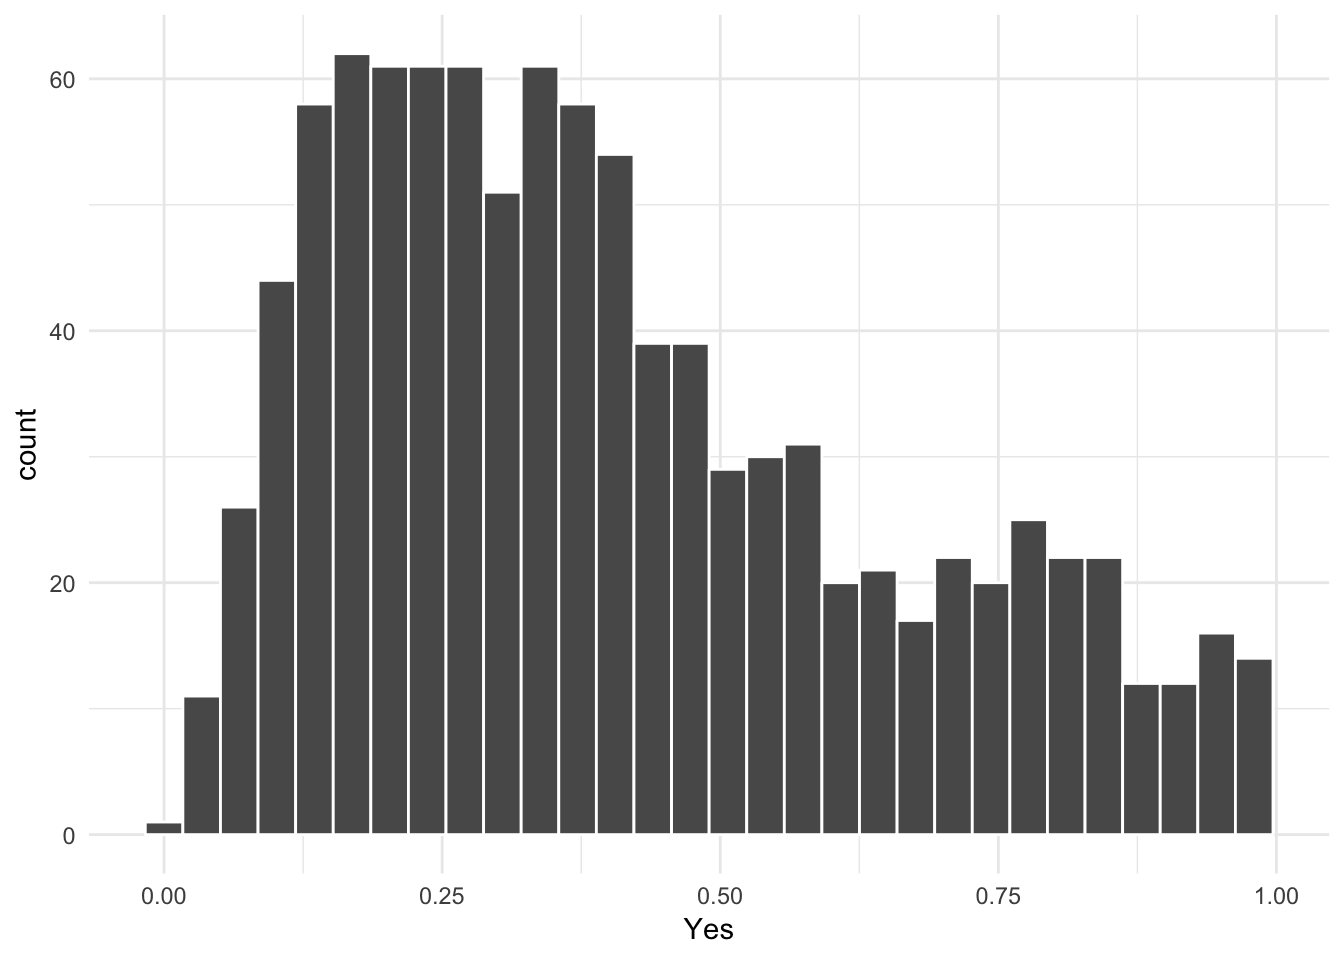
Looks like the histogram is positively skewed, which suggests that many people on the list are unlikely to buy. However, marketers don’t have to stick to the 50% probability cutoff. Instead, we can prescribe cutoffs based on our own experience in the past. For instances, we can use a rule to create segments for targeting. Here I give you a few examples:
Call the prospects with at least 70% probability right away.
For the prospects with probabilities between 20% and 70%, use expert salespersons to call.
Ignore all the prospects with less than 20% probability.
Clearly, these cutoffs seem arbitrary. In reality, such decisions are made after some brainstorming and doing some experimentation.
This is the end of the exercise.26
What other prescriptions can you give to the company?↩