8.8 Optimal number of clusters
Ideally the cluster analysis should result in clusters with low within cluster variance and high between cluster variance. The first “elbow” on the plot gives us the optimal number of clusters. We will use fviz_nbclust() function from factoextra package. In argument wss stands for “within sum of squares”. As we increase the number of clusters, wss should go down. Usually in the plot we see a kink or elbow after which wss flattens out. This is a somewhat subjective process.
fviz_nbclust(cluster_data_pro, kmeans, method = "wss")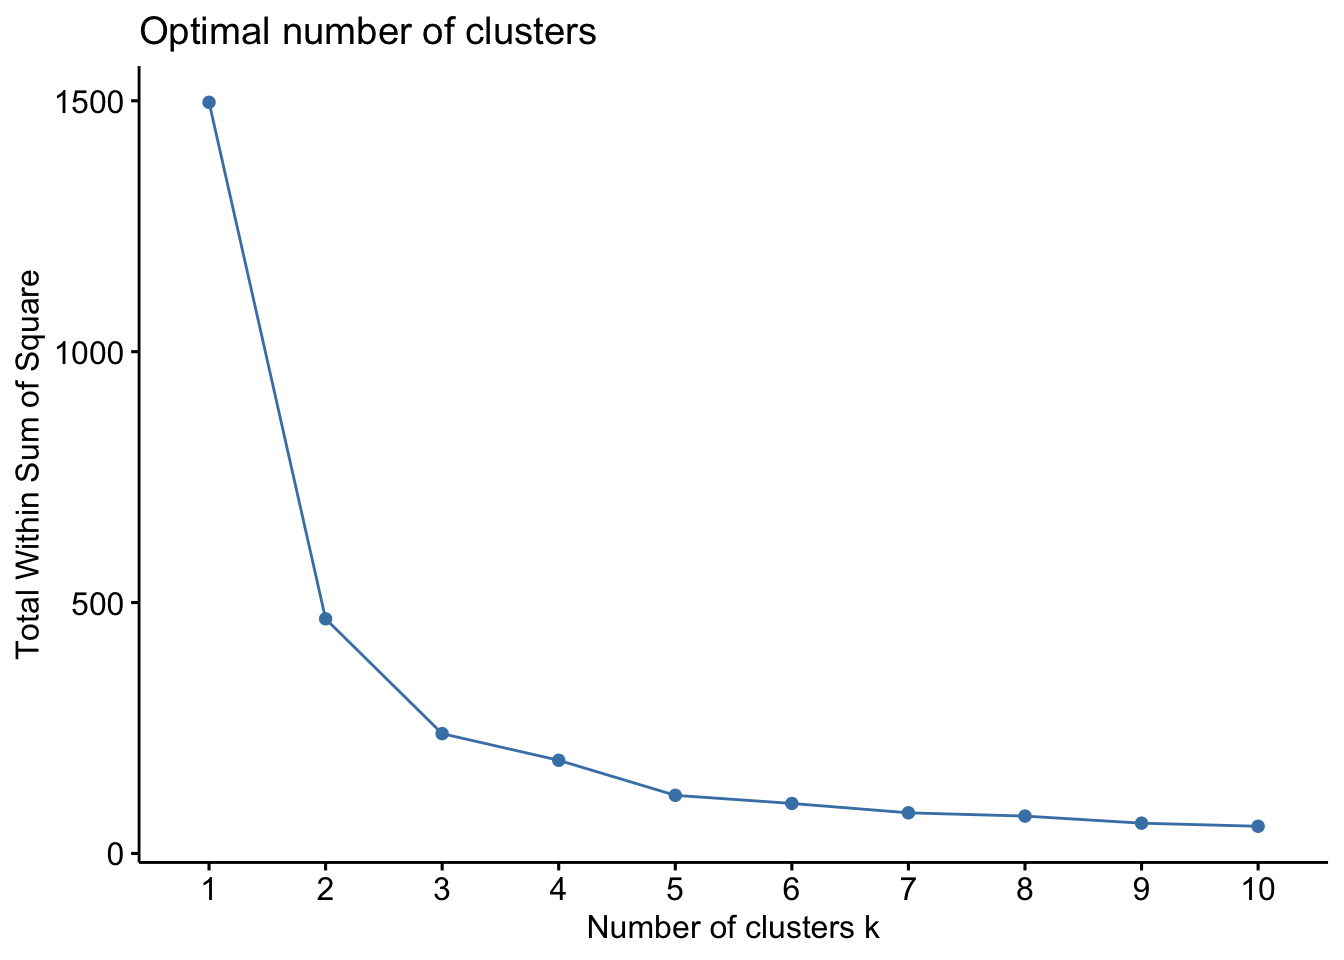
Figure 8.2: Optimal Number of Clusters
In Figure 8.2, the kink occurs when the number of cluster is at 4 or 5 depending how sensitive you are to the decrease in wss visually. For this example, we will consider 4 clusters as optimum.